Grid from text Examples
This document gives instructions for combining the graph drawing tool on https://csacademy.com/app/graph_editor/ with pgm-ds. Please note that the graph drawing tool is not linked to the power-grid-model project. This example solely illustrates how to use their editor to create a simple graph which can be loaded into power-grid-model-ds using a .txt file.
Creating input data for pgm-ds
Drawing a grid
The graph editor on https://csacademy.com/app/graph_editor/ is a very intuitive and easy to use tool for quickly drawing a grid.
A graph can be created by defining branches between nodes.
If you follow a specific syntax, you can use the input from the graph editor to transfer your drawing to pgm-ds:
A source node should be prefixed with
Se.g:
S1,S2
A line is defined as
<from_node> <to_node>From nodes can be both regular nodes and source nodes
e.g.:
S1 2,3 4
A transformer is defined as
<from_node> <to_node> transformere.g.:
8 9 transformer
A grid opening is defined by adding
opene.g.:
4 5 openfor lines or6 7 transformer,openfor transformers
Loading a drawn grid into pgm-ds
Once you’ve created a grid, copy the Graph Data of your grid to a text file (e.g. my_grid.txt).
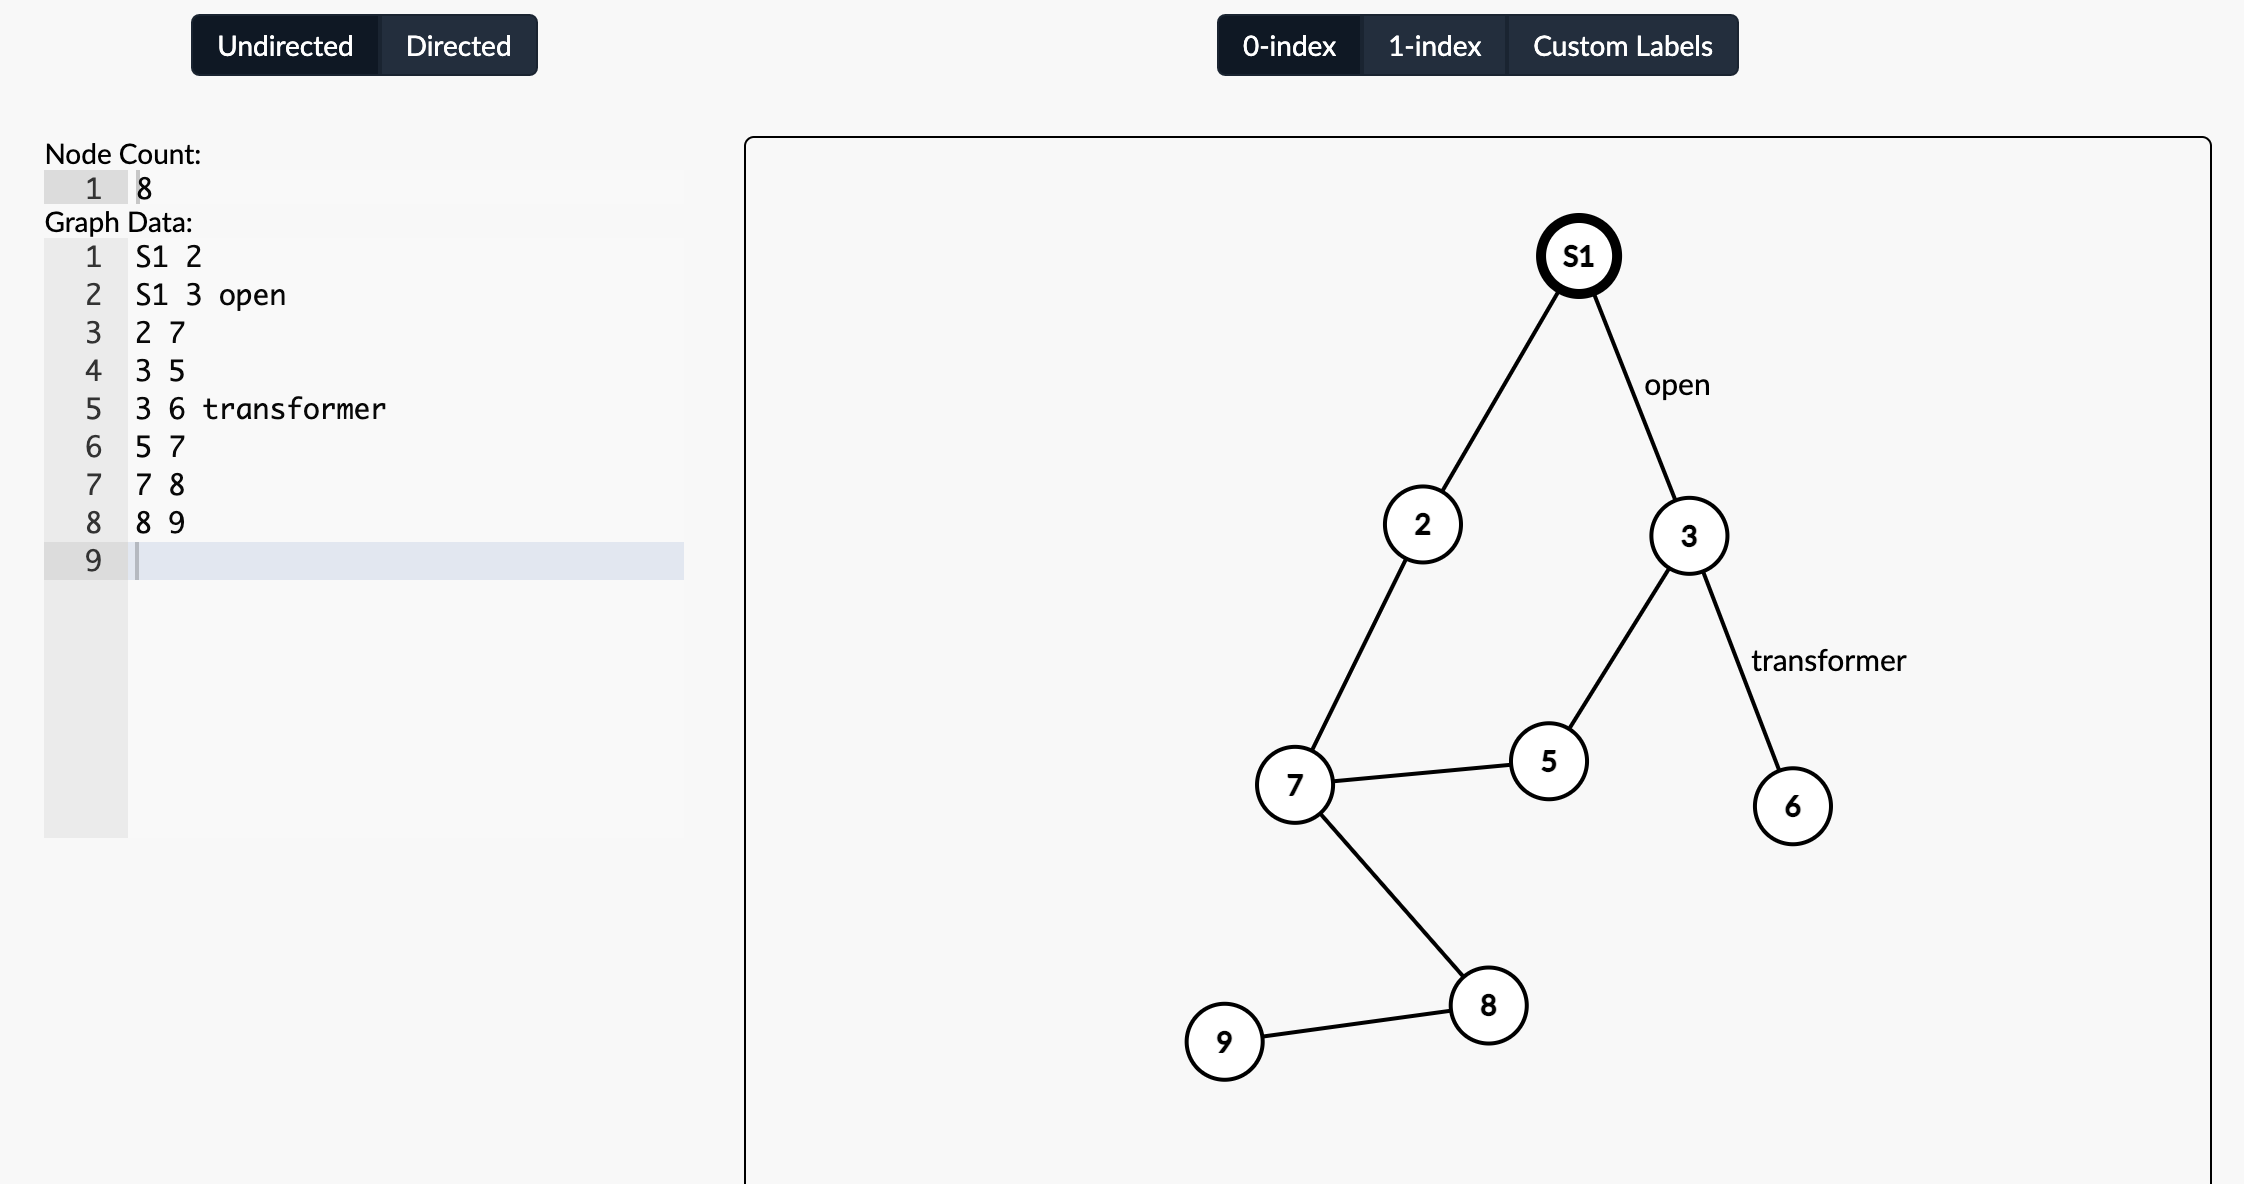
For example, your file could contain the following data:
S1 2
S1 3 open
2 7
3 5
3 6 transformer
5 7
7 8
8 9
Then, using python’s pathlib module, navigate to your file and load your grid
from pathlib import Path

from power_grid_model_ds import Grid

txt_file_path = Path("../../_static/my_grid.txt")
grid = Grid.from_txt_file(txt_file_path)
You should now have a grid loaded from your drawn graph data!
print(grid)
3 6 14,transformer
S1 2 10
S1 3 11,open
2 7 12
3 5 13
5 7 15
7 8 16
8 9 17